Power curve and mean maximum values
Power curve and mean maximum values
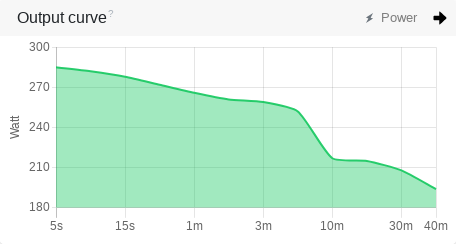
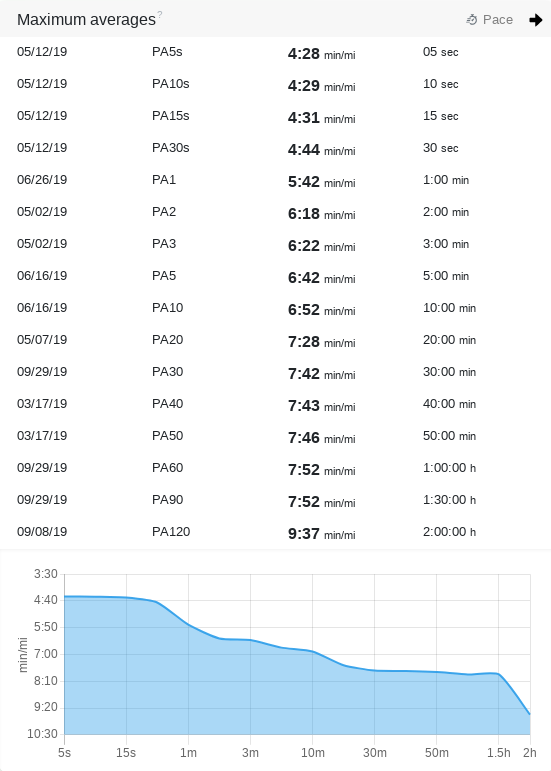
The performance curve shows you the maximum average values for the selected zone type in chronological order.
Example: 1m at 270 watts is the maximum wattage you have maintained for one minute.
Determining training type
With a glance at the heart rate, wattage, pace or cadence curve, you can find out which category the training belongs to.
Examples:
- Interval training with warm-up phase has very high maximum values in the shorter time ranges.
- A tempo training has high maximum values in all time ranges.
- A light long workout has low values in all time ranges.
- A cadence curve with very high short, high medium and low long values is typical of a profiled trail run.
Approximate Maximum Heart Rate, FTPa or FTP
With the performance curve you can approach your FTPa and FTP after a high-intensity competition over 60 minutes, or find your maximum heart rate.
- Maximum heart rate -> HR5s
- Functional Threshold Pace (FTPa) -> PA60
- Functional Threshold Power (FTP) -> P60
As it is not advisable to simulate a competition during training for testing reasons, there are different variants of lower-effort performance tests to discover the three above-mentioned values. The performance curve will help you here as well.
The records overview in the analysis shows you the maximum values of your training over a certain period of time.
Remove incorrect values
If incorrect readings are displayed as a record in the analysis, you can deactivate the corresponding training on the training page to remove it from the analysis.